Blogs
Show City & State Data on One Tableau Map
Step 1: Double Click [State] to create a map. Double click [City] Step 2: Right click [Sales] and create a calculated field. You will need

Step 1: Double Click [State] to create a map. Double click [City] Step 2: Right click [Sales] and create a calculated field. You will need
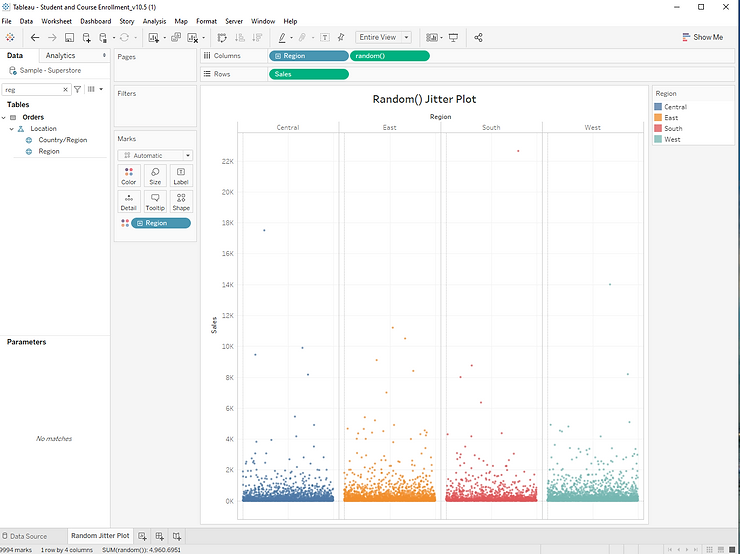
How do you find the correlation of two aggregated values in tableau in this example I have a scatter plot of kpi and kpi2 and

How do you highlight the max value in tableau in this example I have a table with kpi business line and product and i’ve highlighted
Step 1: Drag [Sales] to the rows shelf, and [Region] to the columns shelf. Step 2: Click Analysis, and unselect “Aggregate Measures”. This will result
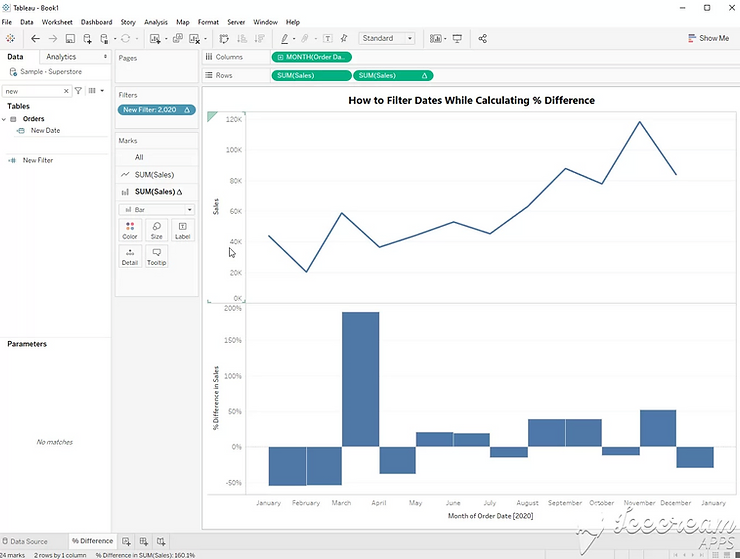
Filters can cause problems when using table calculations in Tableau. Here’s a trick to use a filter while also using table calculations. We’ll use the
How do you format positive and negative values in tableau in this example I have sum of profit by state and region and I’m showing
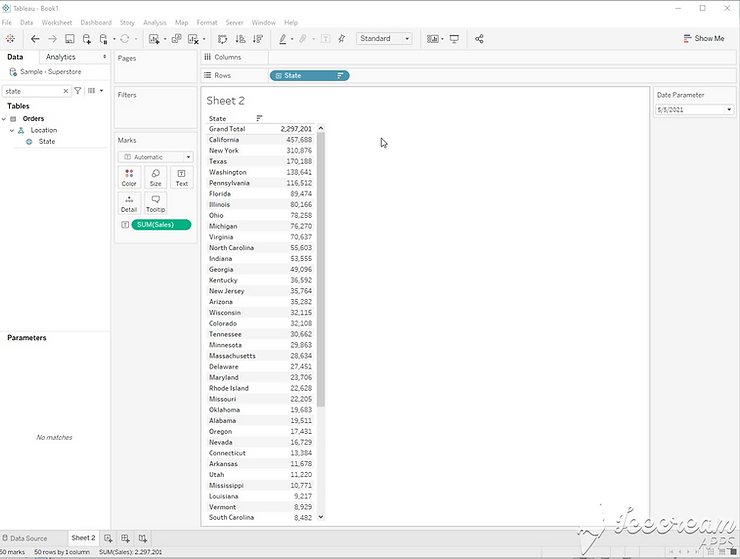
Step 1: Start with [State] on rows, and sum([Sales]) on Text. Step 2: Create a rank calculation. Rank(Sum([Sales])) Step 3: Add the calculation to the
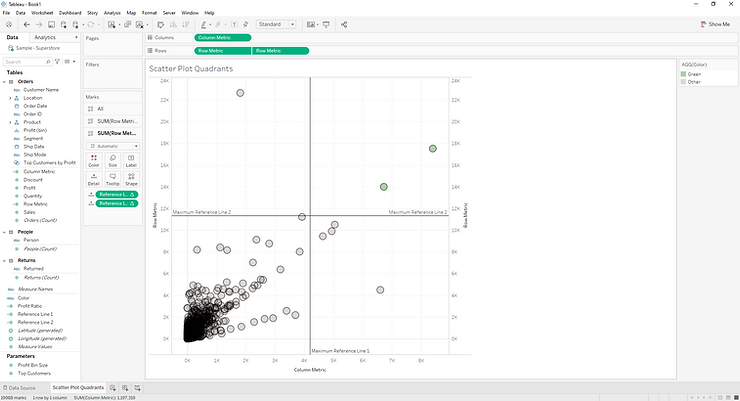
Step 1: Build a scatter Plot using a metric on columns and a metric on rows. Unselect aggregated measures to finalize the scatter plot. Step
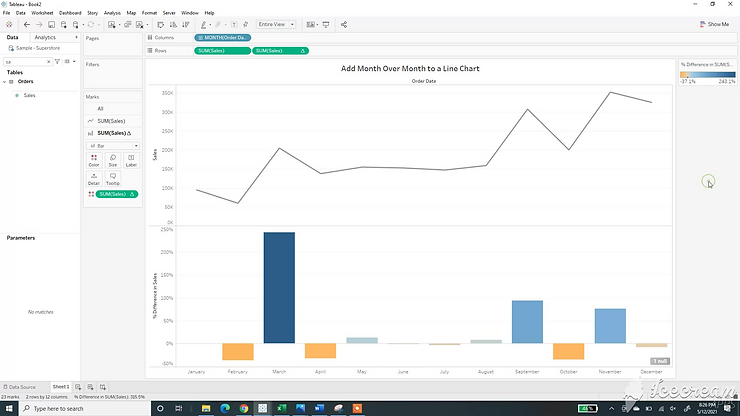
Step 1: Start by adding Month to columns, and Sales to rows. This will give you a line chart. Step 2: Hold the control key
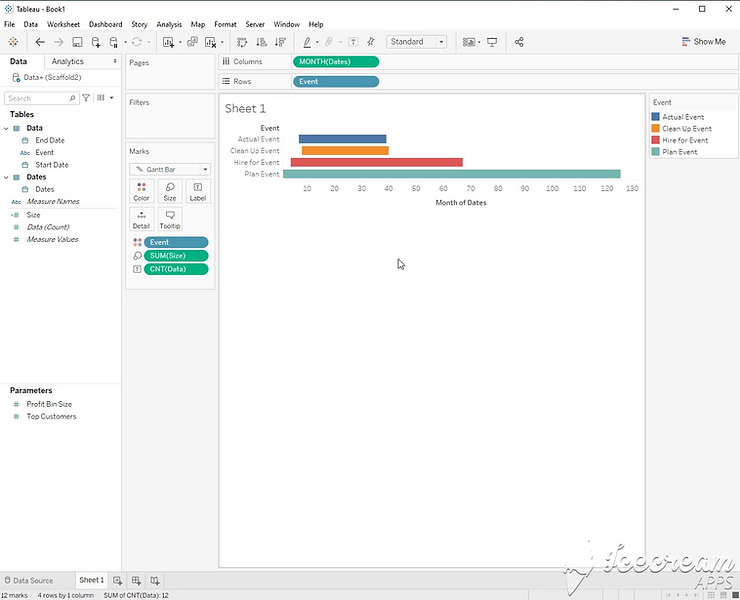
Step 1: Create a Dates Table Step 2: Join the dates table with your data on [Start Date] <= [Date] and [End Date] >= [Date]
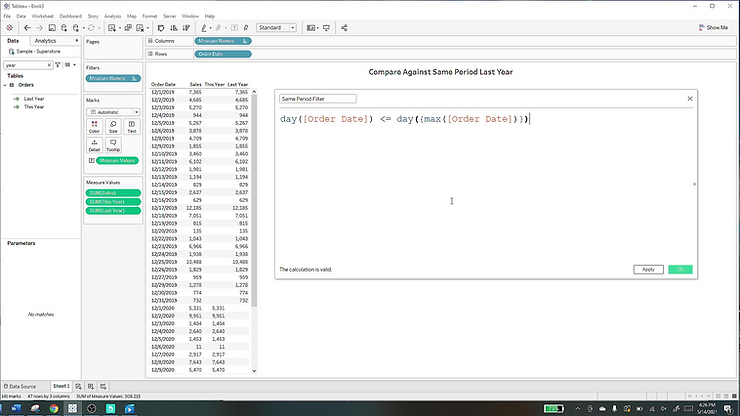
Let’s start with a simple example. Within a single calculation, all parts of a calculation must be either aggregated or not aggregated. This calculation is
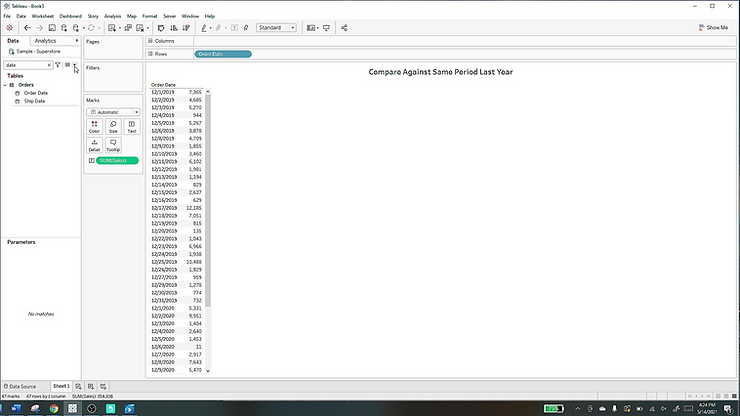
Step 1: Create a crosstab by dragging order date to rows, and sales to the text shelf. In this data, we only have December 2019
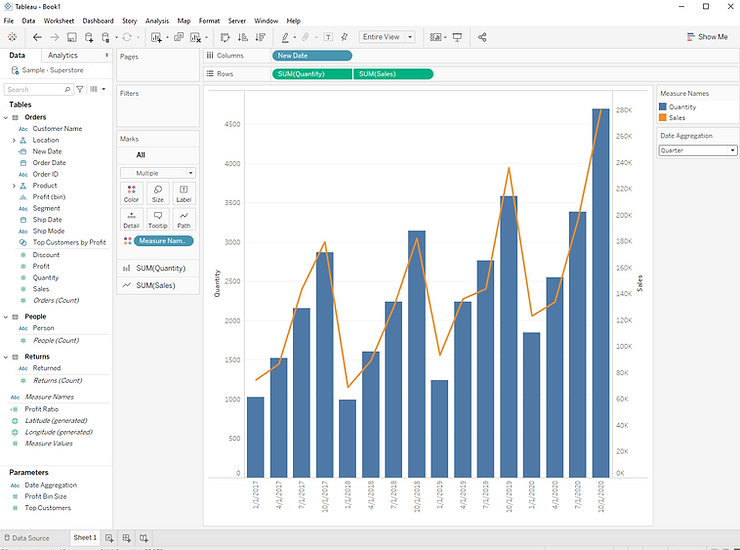
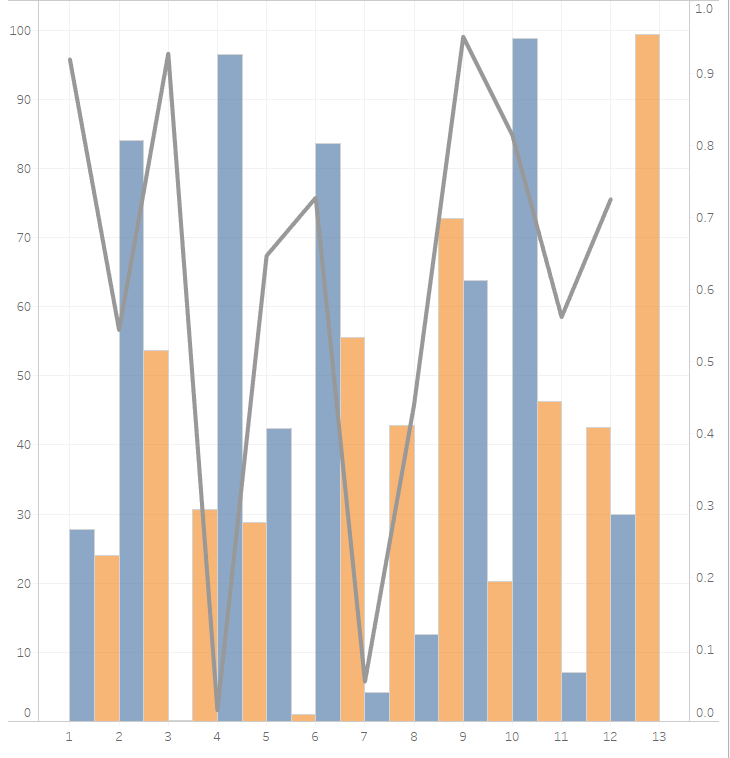
Step 1: Build a dual axis chart using [Date], [Quantity], and [Sales]. The result will be a combined bar and line chart. Step 2: Create
Step 1: Select all of your metrics. Right click one of them. Select Transform > Pivot. This will give you pivot field names and pivot
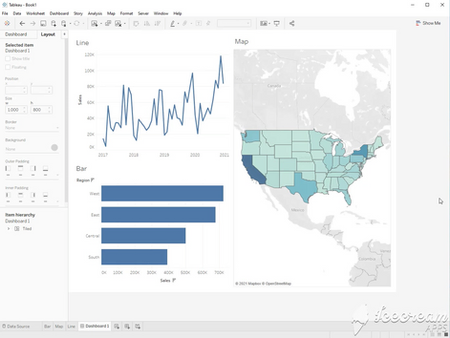
0:00 / 1:54 Step 1: Start with three sheets. A Bar Chart, Line Chart, and a Map View. Step 2: Set your objects to Floating.