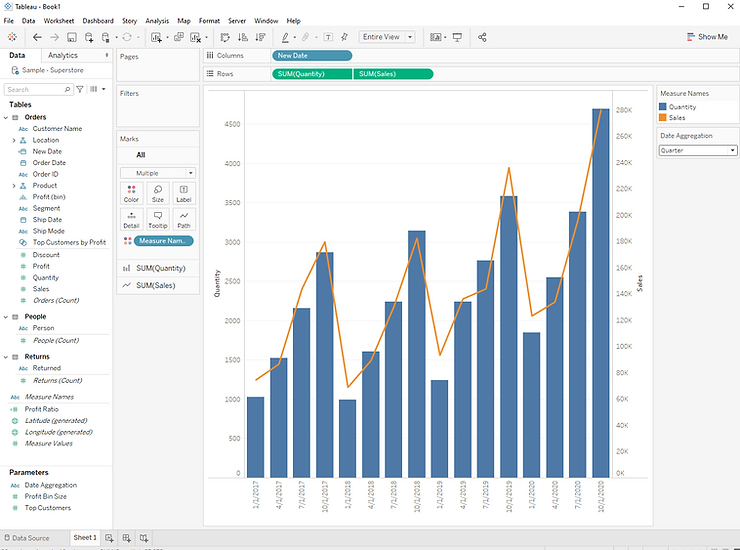
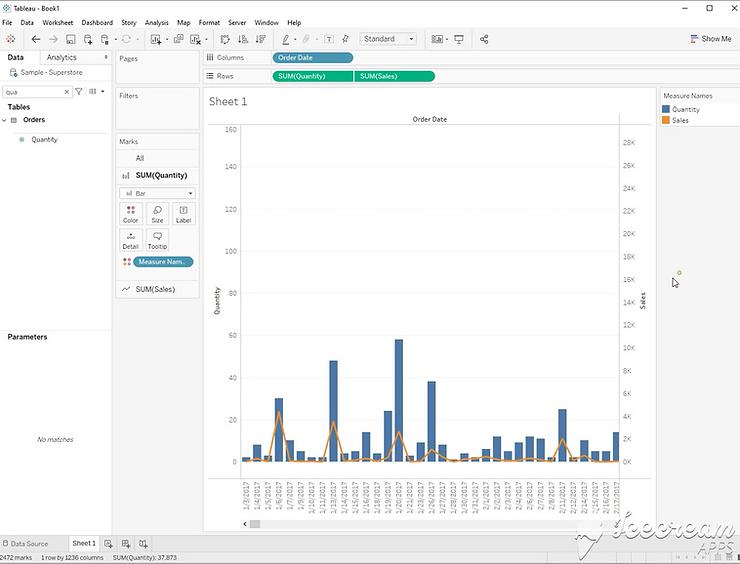
Step 1:
Build a dual axis chart using [Date], [Quantity], and [Sales]. The result will be a combined bar and line chart.
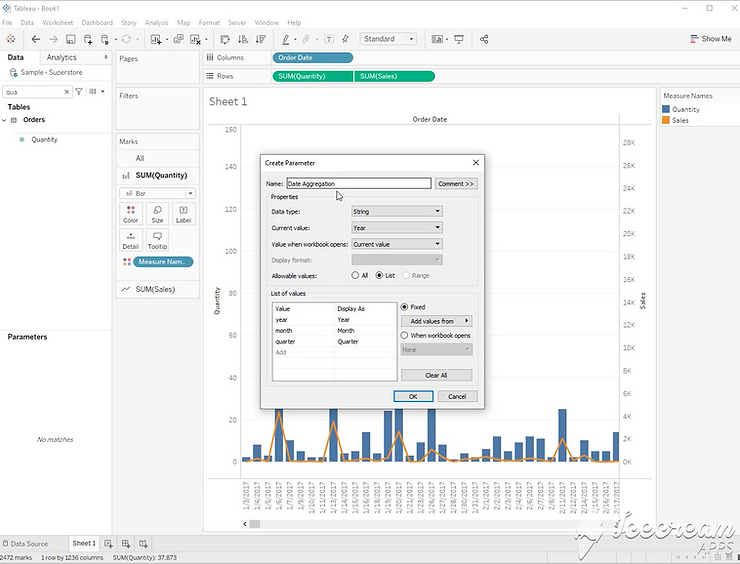
Step 2:
Create a string parameter with these options. year, quarter, month. Make sure they are not capitalized. You can set an alias with a capital letter for display purposes.
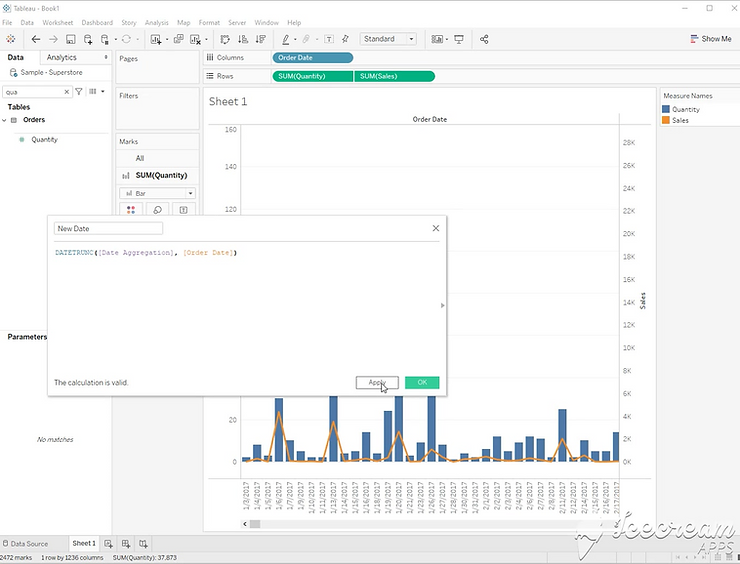
Step 3:
Create this calculated field to serve as the date that is controlled by the parameter.
DATE(DATETRUNC([Date Aggregation], [Order Date]))
Step 4:
Add [New Date] to the column shelf as “Exact Date”. Right click your parameter, and select “Show Parameter.