Filters can cause problems when using table calculations in Tableau. Here’s a trick to use a filter while also using table calculations. We’ll use the lookup function to force the filter to be applied after all other calculations.
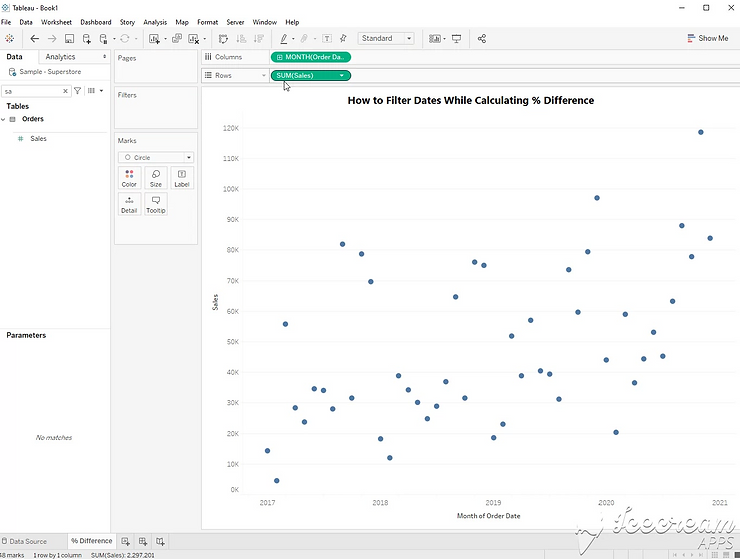
Step 1:
Build a line chart using Month([Date]) and sum([Sales])
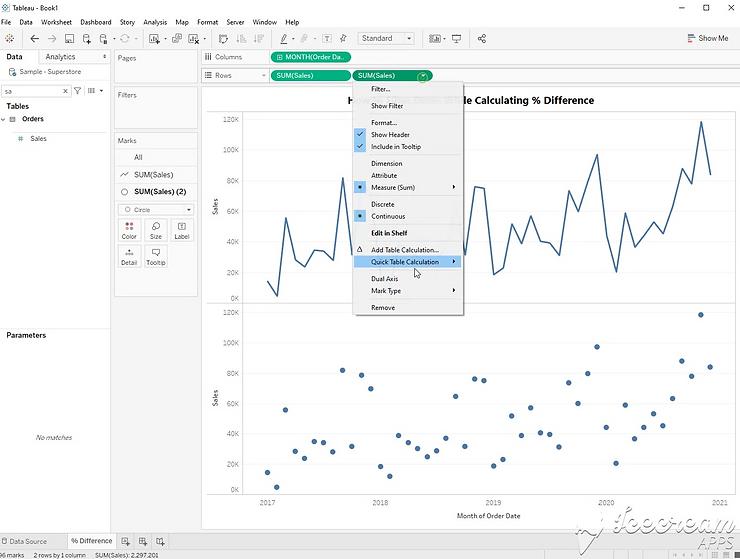
Step 2:
Copy the sales pill, and add a quick table calculation; Percent Difference
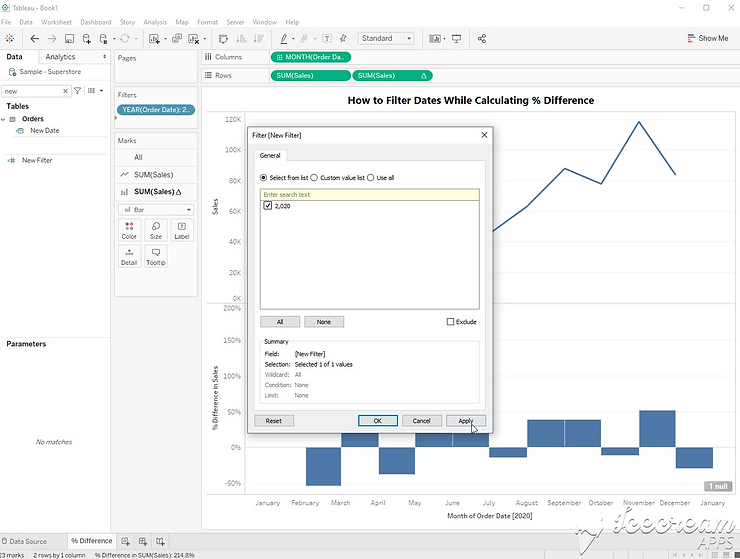
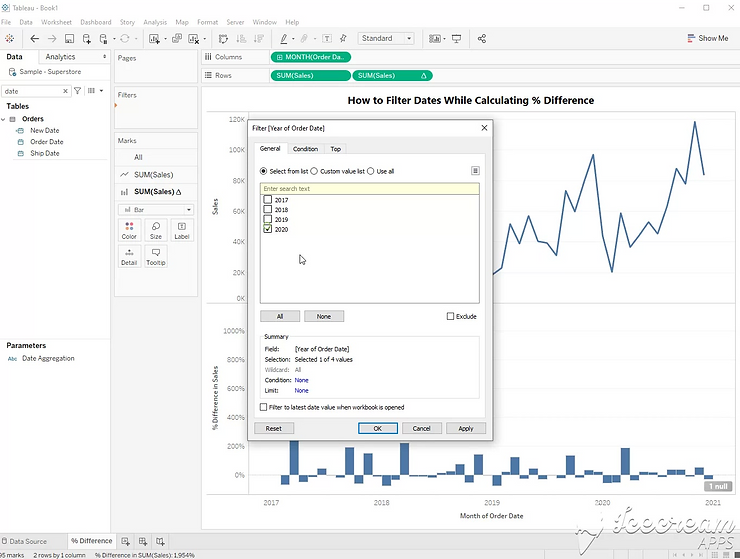
Step 3:
Add a filter for the year 2020 only. The data is now filtered to 2020, but January is missing a percent difference value. The table calculation will not work when data is filtered out.
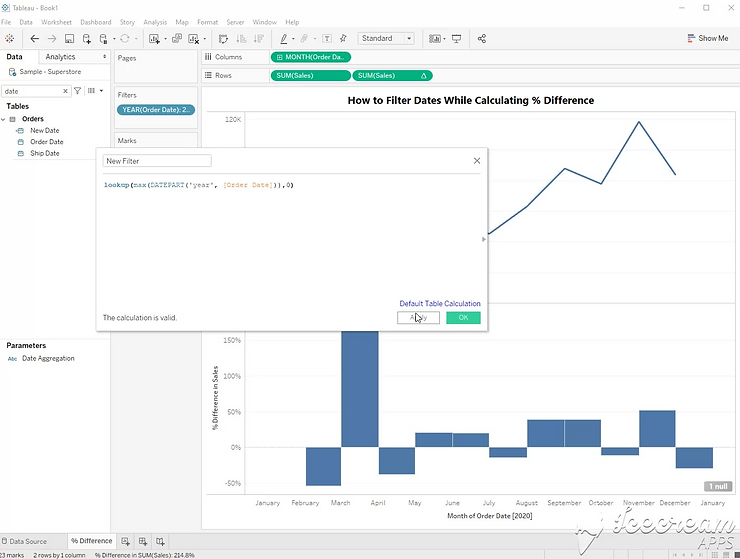
Step 4:
In order to avoid the filter, use the lookup function to create a filter as a table calculation instead. Now, the filter will be applied after the percent difference is calculated.
lookup(max(DATEPART(‘year’, [Order Date])),0)
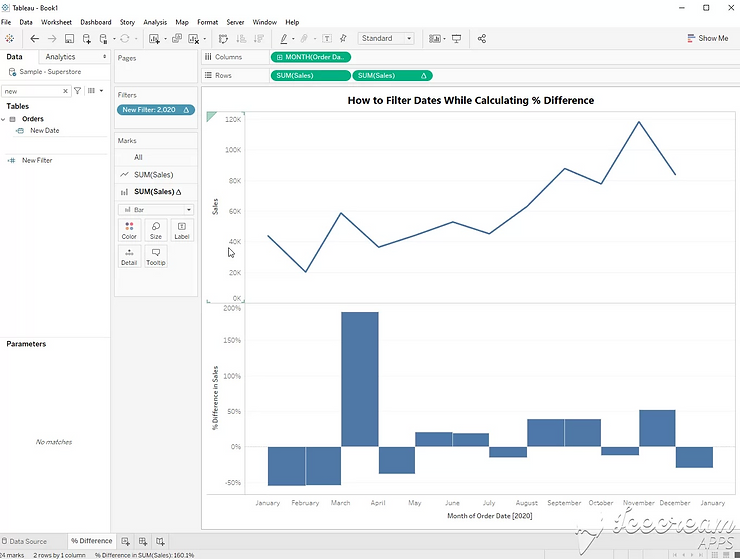
Step 6:
Convert the new filter to discrete and drag it to the filter shelf. Now, January is displaying a value.