Step 1:
Double Click [State] to create a map. Double click [City]

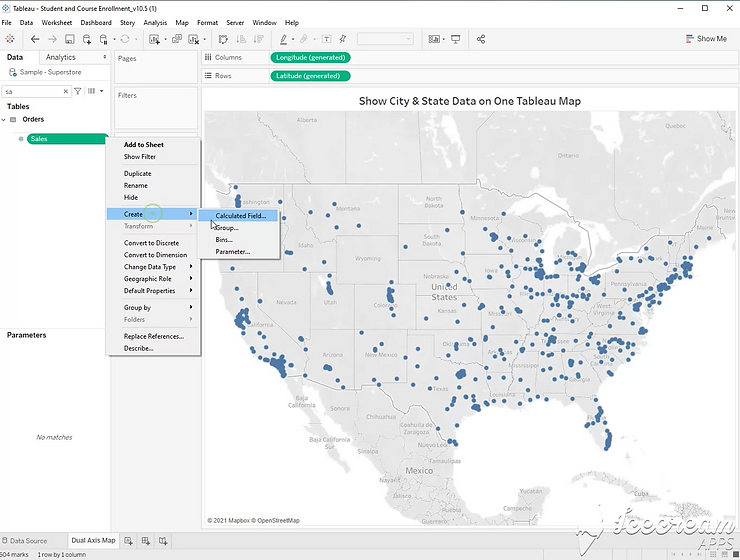
Step 2:
Right click [Sales] and create a calculated field. You will need a duplicate of your measure in order to show both types of map.
Step 3:
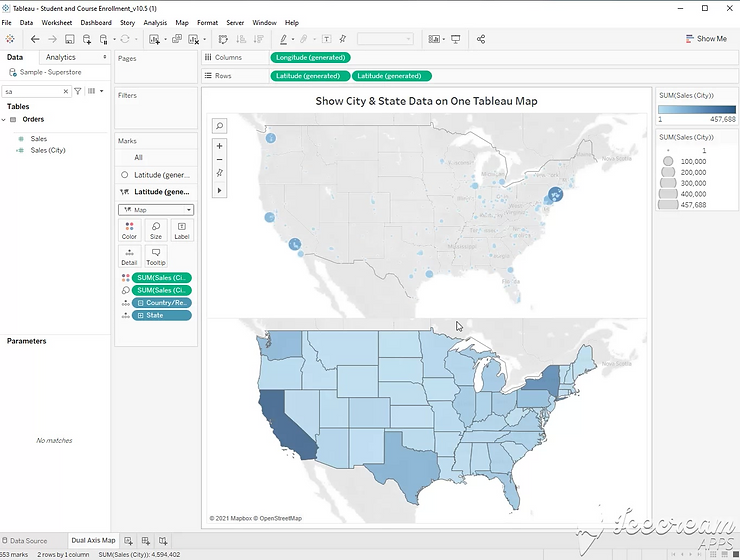
Drag the new calculated field to color, and size.

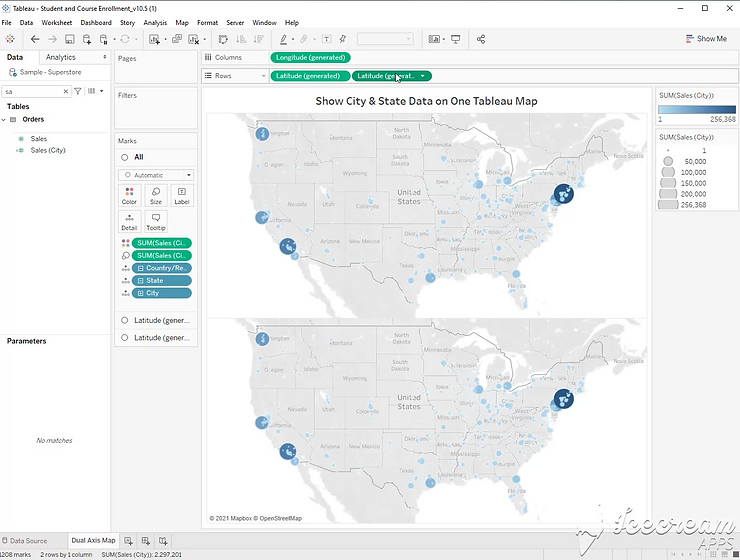
Step 4:
Hold the control button down to copy the latitude pill. This will give you a dual axis map.
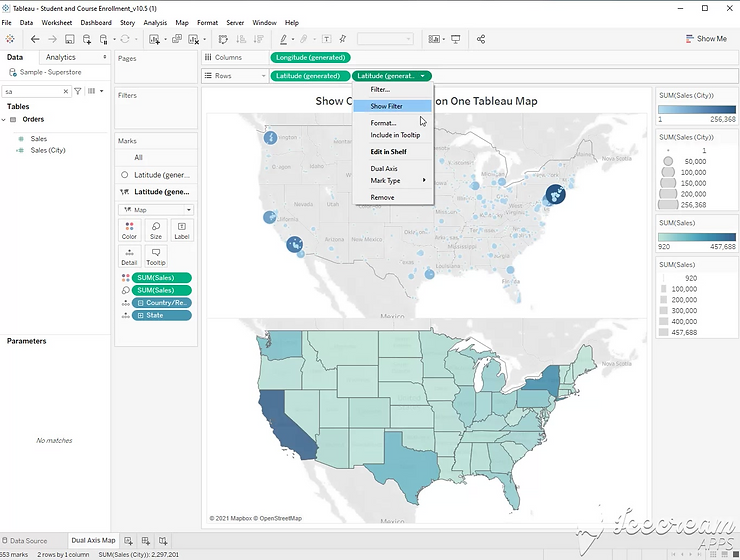
Step 5:
On one of your axis, remove [city], and change the mark type to filled map.
Step 6:
Replace the new calculated field with sum of sales on size and color.
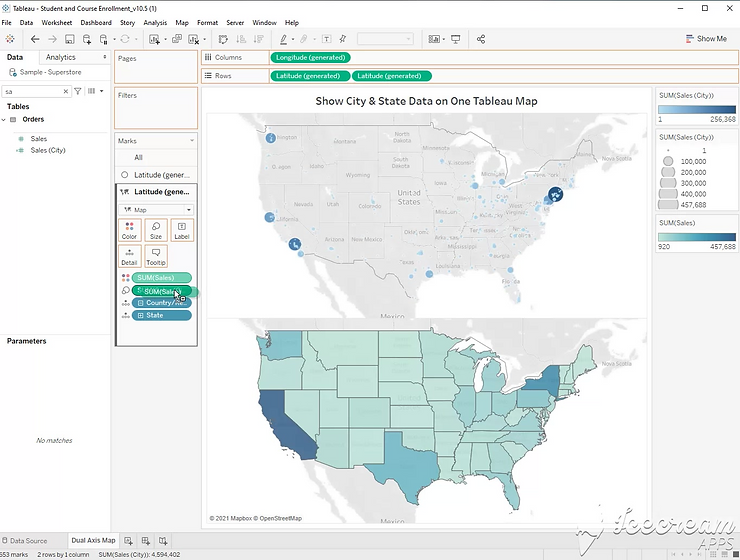
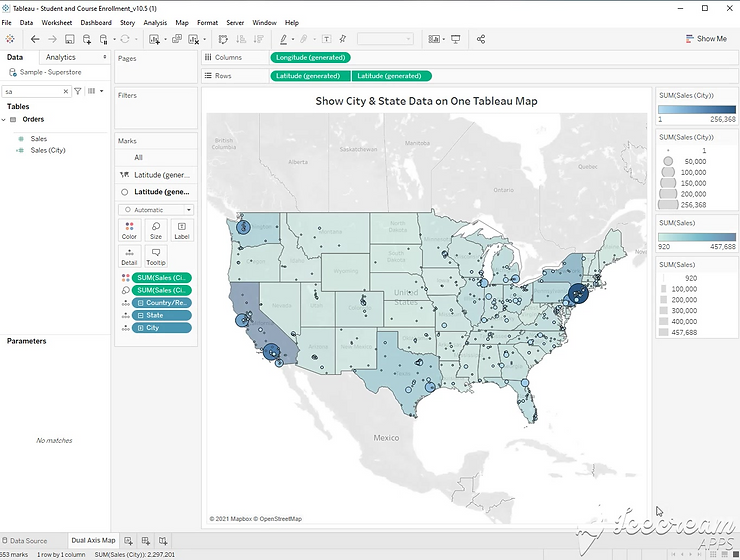
Step 7:
Click the dropdown on the second latitude pill and select “Dual Axis”