
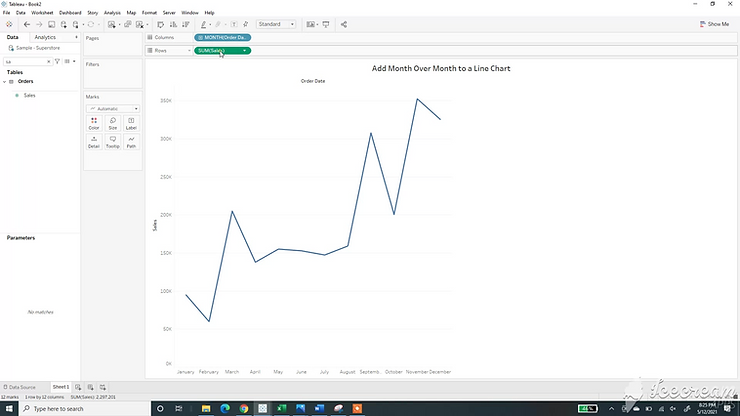
Step 1:
Start by adding Month to columns, and Sales to rows. This will give you a line chart.
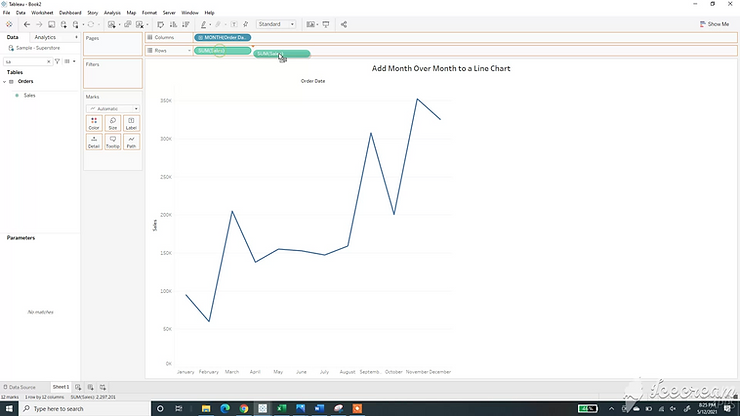
Step 2:
Hold the control key down, and drag the sales pill to the right. This will copy your measure.
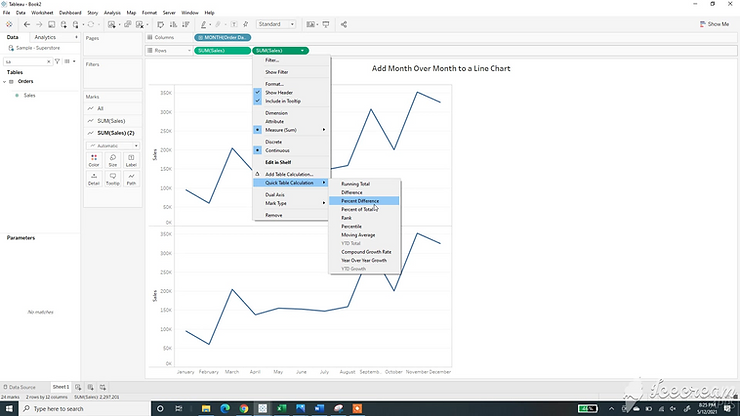
Step 3:
Click the drop down on your second sales pill. Select quick table calculation, then percent difference.
Step 4:
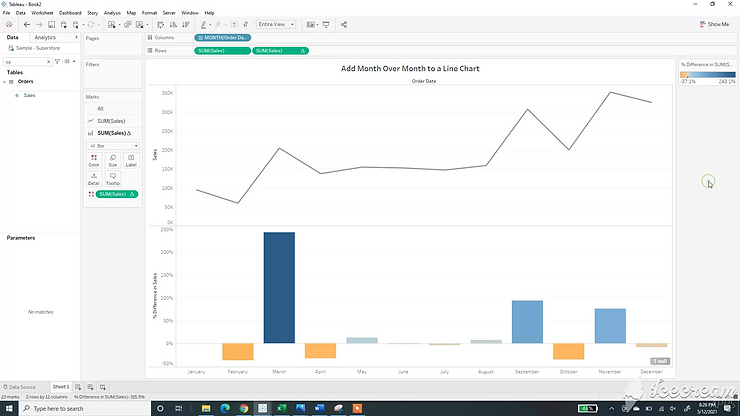
Copy the pill again to color to add another visual element.
