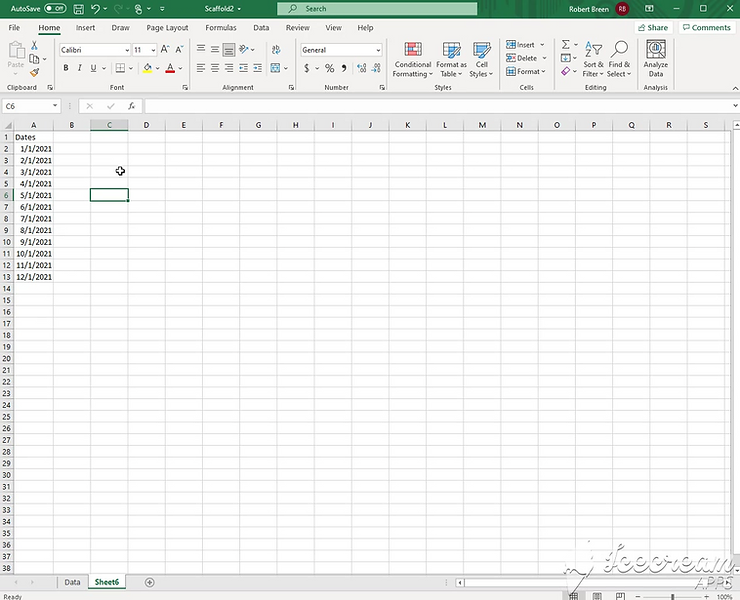
Step 1:
Create a Dates Table
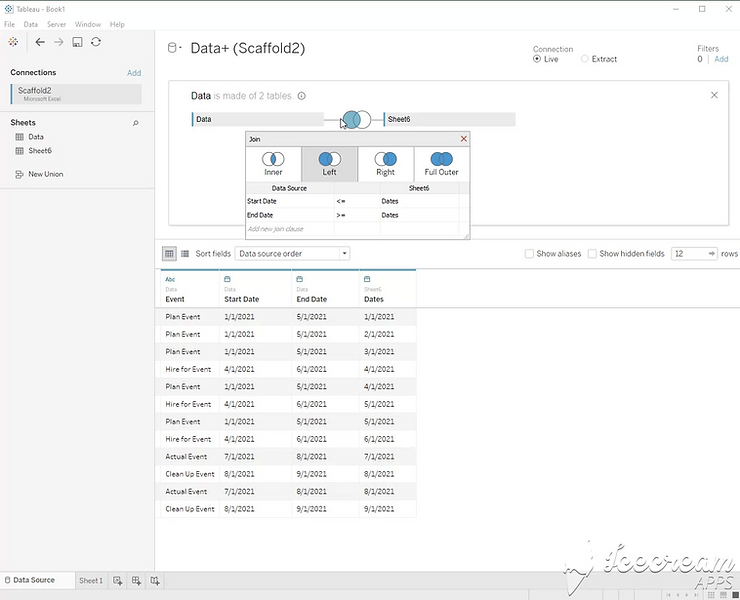
Step 2:
Join the dates table with your data on [Start Date] <= [Date] and [End Date] >= [Date]
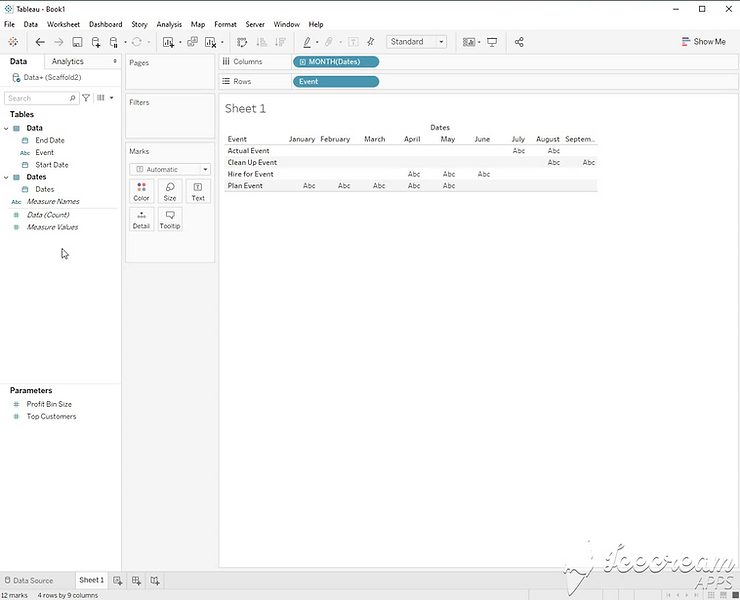
Step 3:
Drag [dates] to the column shelf
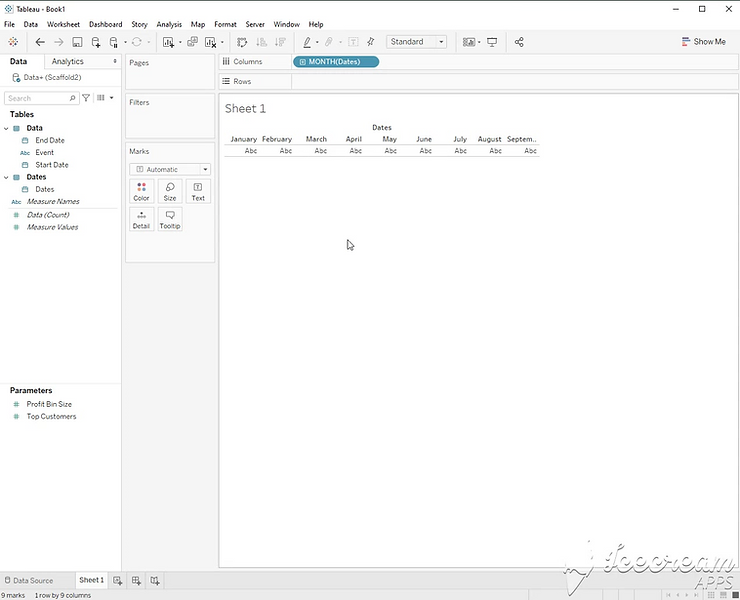
Step 4:
Drag [Event] to the row shelf
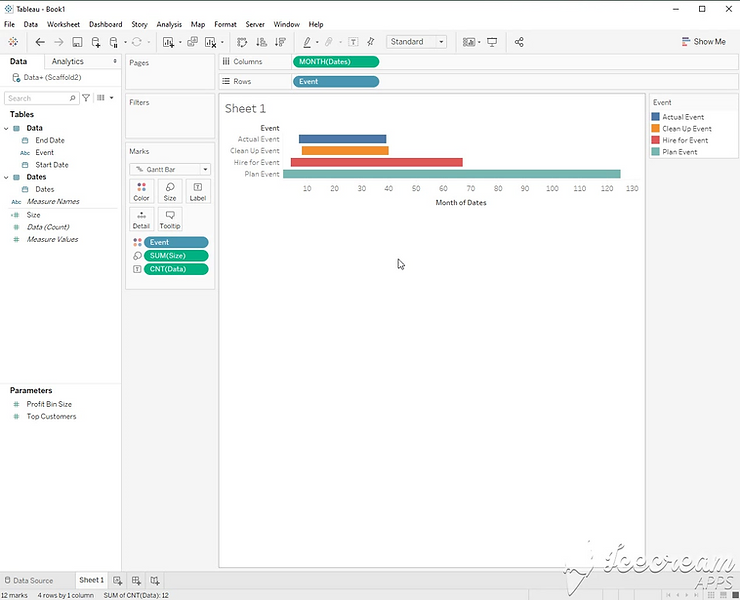
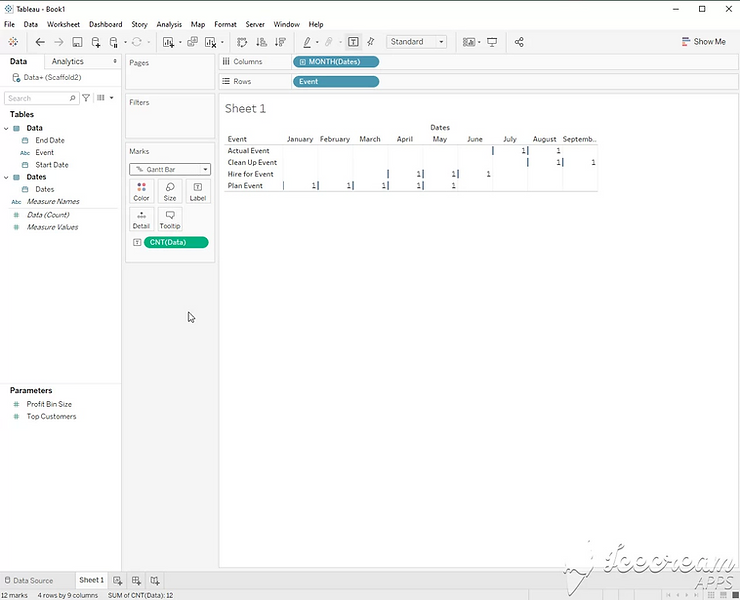
Step 5:
Choose Gantt Bar as the chart type
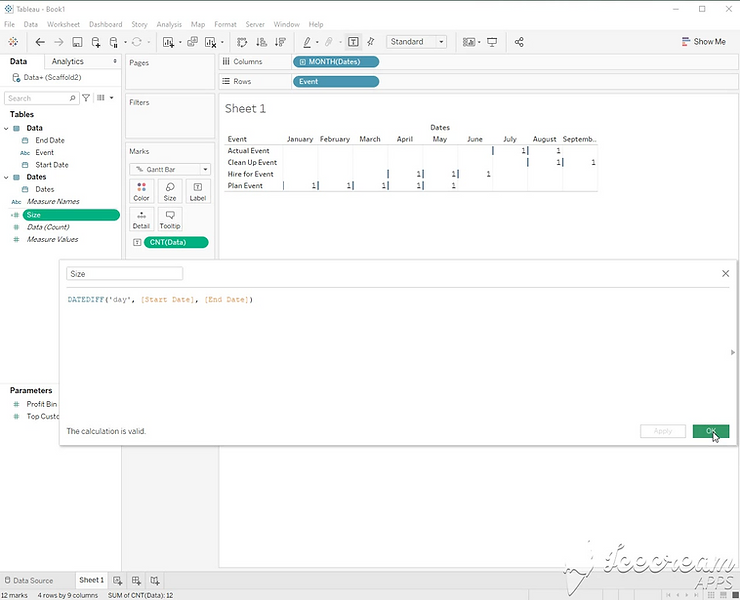
Step 6:
Use this calculation for size. DATEDIFF(‘day’, [Start Date], [End Date])
Step 7:
Finalize your view by making [Dates] continuous, dragging [Size] to size and adding color