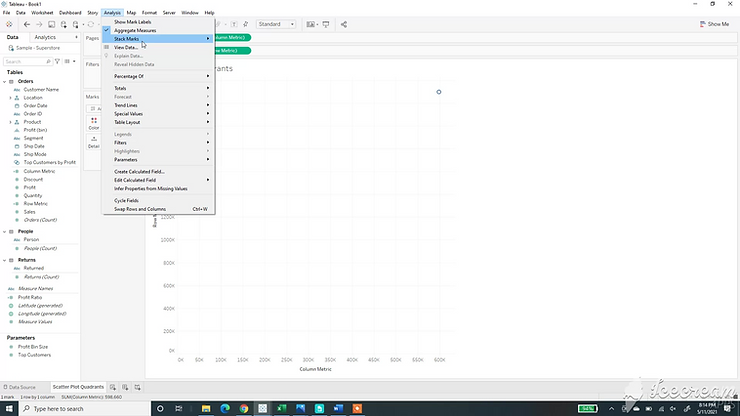
Step 1:
Build a scatter Plot using a metric on columns and a metric on rows. Unselect aggregated measures to finalize the scatter plot.
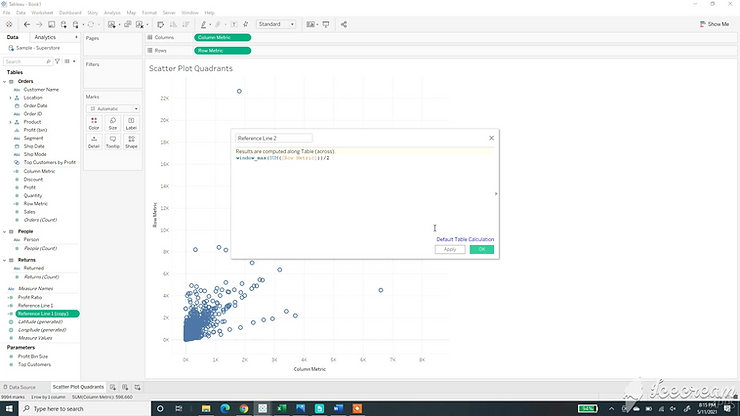
Step 2:
Create two calculations for reference lines.
window_max(SUM([Column Metric]))/2
window_max(SUM([Row Metric]))/2
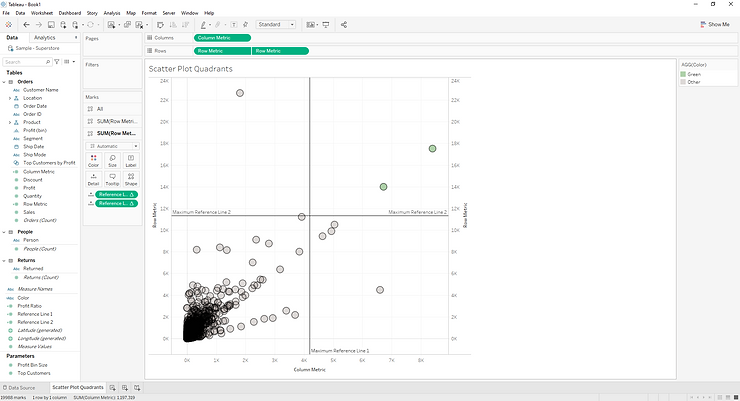
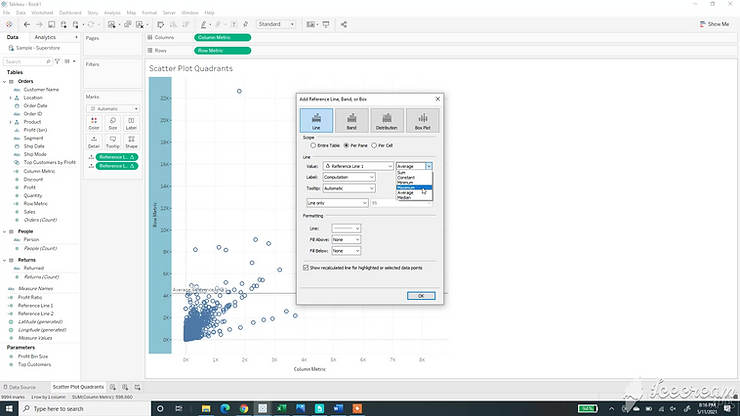
Step 3:
Add the reference line metrics as a reference line on the x axis and the y axis. This will give you a quadrant like view.
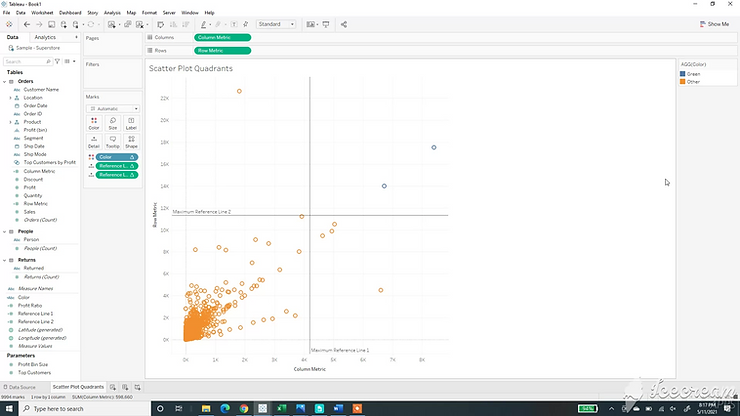
Step 4:
Use this calculation to color the marks in the quadrant. Continue with elseif’s if you want to color other quadrants within the scatter plot.
if SUM([Column Metric])>= [Reference Line 1] and SUM([Row Metric]) >= [Reference Line 2] then “Green” else “Other” END