Vaccine Inventory Dashboard: Overview and Benefits

Desciption

Overall Summary of the Dashboard:
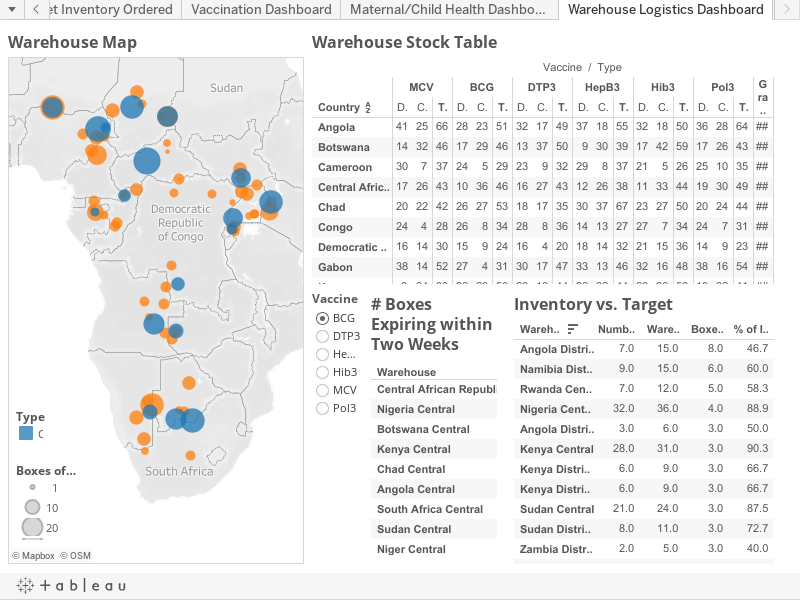
This dashboard contains a warehouse map, a warehouse stock table, and a graph of vaccine inventory compared to targets within two weeks. The dashboard provides information about the types, boxes, and distribution of various vaccines in different warehouses and countries.

Bullet Points about the Dashboard:
– Shows the types, boxes, and distribution of vaccines in different warehouses and countries
– Includes a warehouse map and a warehouse stock table
– Graphs vaccine inventory compared to targets within two weeks

Summary of Who Can Benefit from Using the Dashboard and How:
The dashboard can be beneficial to those who need to manage and keep track of the types, boxes, and distribution of vaccines in different warehouses and countries. The warehouse map and warehouse stock table can provide an overview of the vaccines in different warehouses and countries, while the graph can help track vaccine inventory compared to targets.

Bullet Points about Who Can Use the Dashboard and How it Would Benefit Them:
– Those who need to manage and keep track of the types, boxes, and distribution of vaccines in different warehouses and countries
– Warehouse map provides an overview of the vaccines in different warehouses and countries
– Warehouse stock table provides comprehensive information
– Graph helps track vaccine inventory compared to targets

Data

Warehouse Map
Type
Cen.. Ninte
Boxes of V.. 1
10
2
20
30
© Mapbox OSM
Warehouse Stock Table
Vaccine / Type
MCV
BCG
DTP3
HepB3
Hib3
Pol3
Gr
an
Sudan
Country Angola Botswana
D.. C.. T.. Di.. C.. T.. 41 25 66 28 23 51
D.. C.. T.. Di.. C..
Cameroon
Chad
Congo
220
24 4 28 26
Democratic Republic of Congo
Democratic. 16 14 30 15
Gabon
38 14 52 27
14 32 46 17 29 46 13 37 50 9 30 39 17 42 59 30 7 37 24 5 29 23 9 32 29 8 37 21 5 26 25 10 35 ## Central Afric.. 17 26 43 10 36 46 16 27 43 12 26 38 11 33 44 19 30 49 ## 20 22 42 26 27 53 18 17 35 30 37 67 23 27 50 20 24 44 ## 8 34 28 8 36 14 13 27 27 7 34 24 7 31 ## 9 24 16 4 20 18 14 32 21 15 36 14 9 23 4 31 30 17 47 33 13 46 32 16 48 38 16 54 ##
T.. D.. C.. T.. Di.. C.. T. d..
32 17 49 37 18 55 32 18 50 36 28 64 ##
17 26 43 ##
##
Kenya
Namibia Niger
50 18 68 53 12 65 47 22 17 39 29 20 49 28
6 24 30 22 28 50 26 18 44 22 22 44 26 26 52 19 22 41 10 57 34 19 53 37 14 51
##
38 16 54 ##
19 47 20 22 42 27 16 43 22 21 43
拜拜
##
Vaccine
BCG DTP3
# Boxes Expiring
Inventory vs. Target
within Two Weeks
Warehouse Numbe.. Wareho.. Boxes.. % of In..
HepB3
Angola Distri..
7.0
15.0
8.0
46.7
Hib3
Warehouse
Namibia Dist..
9.0
15.0
6.0
60.0
MCV
Central African Republic
Rwanda Cen..
7.0
12.0
5.0
58.3
Pol3
Nigeria Central
Nigeria Cent..
32.0
36.0
4.0
88.9
Botswana Central
Angola Distri..
3.0
6.0
3.0
50.0
Kenya Central
Kenya Central
28.0
31.0
3.0
90.3
Chad Central
Kenya Distri..
6.0
9.0
3.0
66.7
South Africa
Angola Central
Kenya Distri..
6.0
9.0
3.0
66.7
South Africa Central
Sudan Central
21.0
24.0
3.0
87.5
Sudan Central
Sudan Distri..
8.0
11.0
3.0
72.7
Niger Central
Zambia Distr..
2.0
5.0
3.0
40.0
South Sudan Central
Botswana Di..
5.0
7.0
2.0
71.4
Uganda Central
Congo Distri..
8.0
10.0
2.0
80.0
Namibia District_2
Kenya Distri..
3.0
5.0
2.0
60.0