Overall Summary:
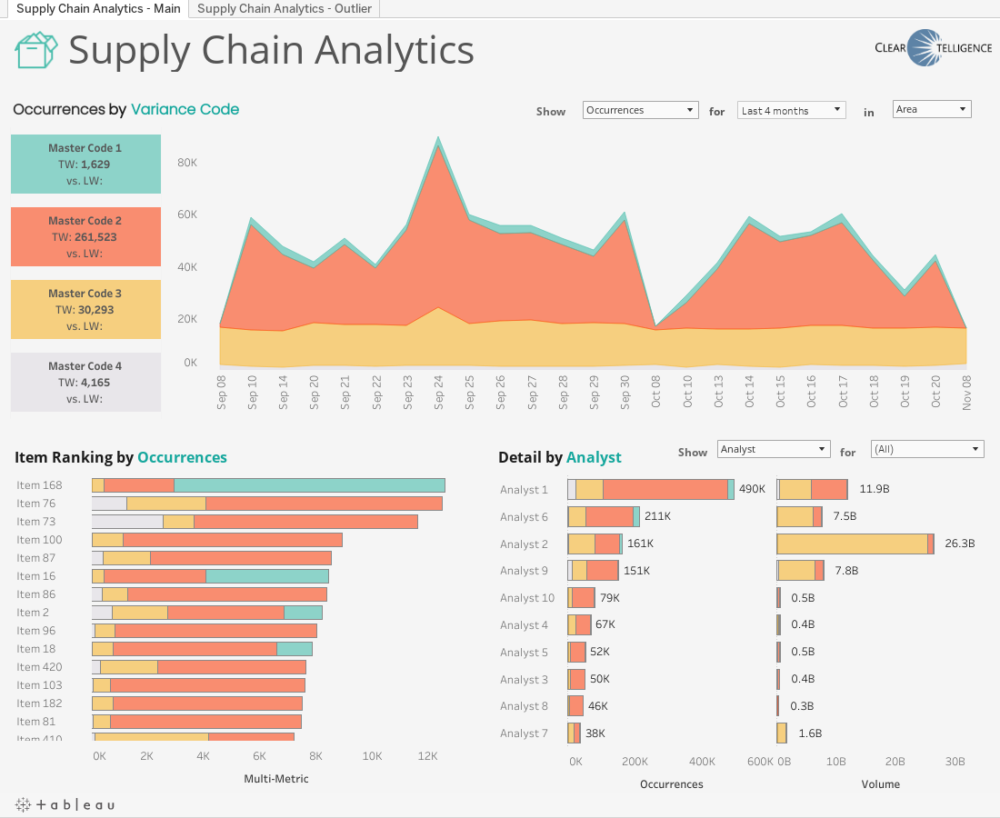
The Supply Chain Analytics dashboard provides a comprehensive overview of the variance between Master Code 1, Master Code 2, Master Code 3, and Master Code 4 by date, item, and analyst. It also includes detailed information about each item and outliers by day.
Bullet Points about the Dashboard:
– Occurrences by Variance Code
– Item Ranking by Occurrences
– Detail Analyst
– Detail by Item
– Outliers by Day
Summary of Who Can Benefit from Using the Dashboard and How:
The Supply Chain Analytics dashboard can be used by supply chain professionals to gain a better understanding of the variance between Master Code 1, Master Code 2, Master Code 3, and Master Code 4. It can help them identify trends in their supply chain and make informed decisions about their operations.
Bullet Points about Who Can Use the Dashboard and How it Would Benefit Them:
– Supply chain professionals can use the dashboard to gain a better understanding of the variance between Master Code 1, Master Code 2, Master Code 3, and Master Code 4.
– The dashboard can help them identify trends in their supply chain and make informed decisions about their operations.
– The dashboard can provide detailed information about each item and outliers by day.
Data
The dashboard is called Supply Chain Analytics, the dashboard Supply Chain Analytics includes, Occurrences by Variance Code, it shows the variance between Master Code 1, Master Code 2, Master Code 3, Master Code 4, by date,Item Ranking by Occurrences it shows the difference between Master Code 1, Master Code 2, Master Code 3 by Item, Detail Analyst, it shows the difference between Master Code 1, Master Code 2, Master Code 3, by Analyst, in the Supply Chain Analytics – Tool, it includes, Detail by Item and Outliers by Day it shows the details by Master Code 1, Master Code 2, Master Code 3, Master Code 4 by date