Overall Summary:
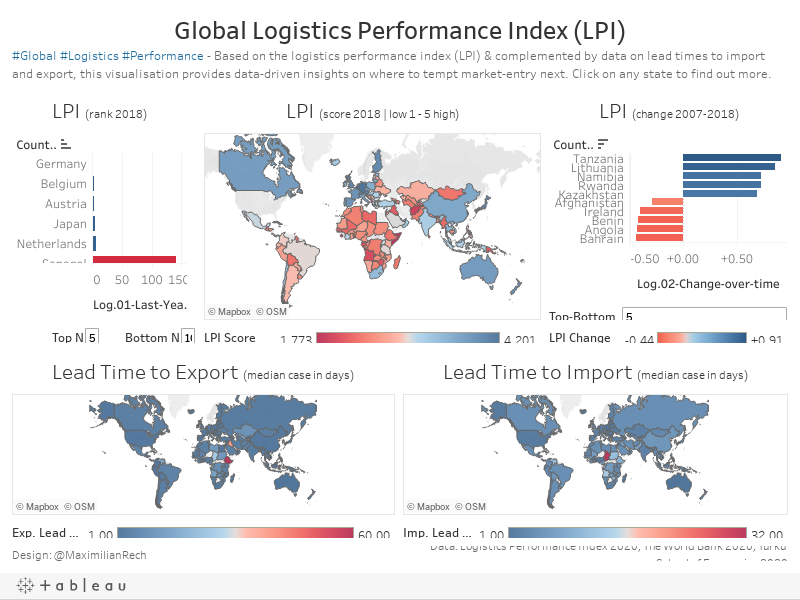
This dashboard provides data-driven insights on logistics performance index (LPI) and lead times to import and export. It contains a map of countries that shows the LPI score, change over time, and lead times. It also includes a top 5 and bottom 10 list of countries.
Bullet Points About the Dashboard:
– Provides data-driven insights on logistics performance index (LPI) and lead times to import and export
– Includes a map of countries that shows the LPI score, change over time, and lead times
– Contains a top 5 and bottom 10 list of countries
– Design by @MaximilianRech
– Data sourced from Logistics Performance Index 2020, The World Bank 2020, and Turku School of Eco..
Summary of Who Can Benefit From Using the Dashboard and How They Would Benefit:
Businesses and entrepreneurs looking to enter new markets can benefit from using this dashboard as it provides data-driven insights on logistics performance index (LPI) and lead times to import and export. This information can help them make informed decisions about which markets to enter and the logistics processes to take in order to do so.
Bullet Points About Who Can Use the Dashboard and How It Would Benefit Them:
– Businesses and entrepreneurs looking to enter new markets
– Provides data-driven insights on logistics performance index (LPI) and lead times to import and export
– Helps them make informed decisions about which markets to enter and the logistics processes to take in order to do so.