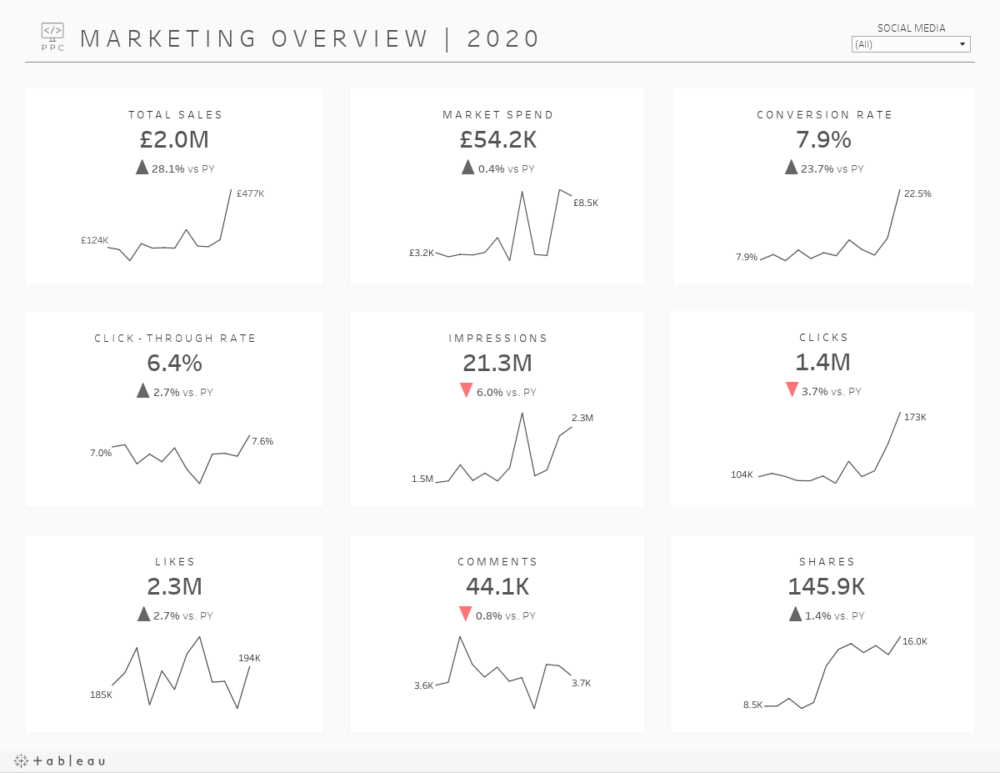
1. The Marketing | KPI Dashboard provides a comprehensive overview of the performance of marketing campaigns for the year 2020, including Total Sales, Market Spend, Conversion Rate, Click-Through Rate, Impressions, Clicks, Likes, Comments, and Shares. It also compares the performance of these metrics to the previous year and displays them by month. The dashboard also allows users to filter the data by platform (Facebook, Instagram, Twitter).
2. Bullet Points about the Dashboard:
• Comprehensive overview of marketing campaign performance for 2020
• Includes Total Sales, Market Spend, Conversion Rate, Click-Through Rate, Impressions, Clicks, Likes, Comments and Shares
• Compares performance to previous year
• Displays data by month
• Ability to filter data by platform (Facebook, Instagram, Twitter)
3. The Marketing | KPI Dashboard can be used by marketers and business owners to gain insight into their marketing campaigns and track their performance over time. It provides an easy way to compare performance across different platforms and identify areas for improvement.
4. Bullet Points about Who Can Use the Dashboard and How it Would Benefit Them:
• Marketers and business owners
• Gain insight into marketing campaigns
• Track performance over time
• Compare performance across different platforms
• Identify areas for improvement
Data
The dashboard is called “Marketing | KPI Dashboard ” The dashboard includes Total Sales, Market spend, conversion rate, click-through rate, impressions, clicks, likes,comments,shares for the year 2020 It is also compared to the previous year.It displays each of these items by month for the year 2020.
These items are displayed for (facebook, instagram, twitter) but you have the ability to filter.