0
8″
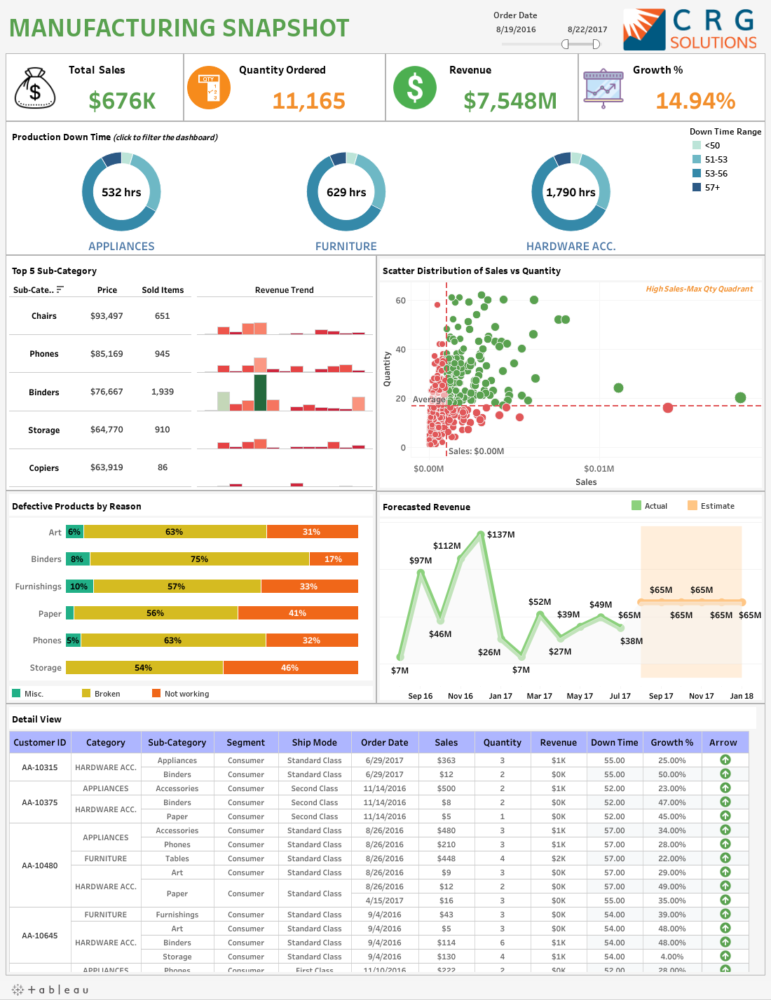
Overall Summary: The Manufacturing Dashboard provides a comprehensive overview of sales, quantity ordered, revenue, percentage of growth, and production downtime. It also includes graphs that explain the top 5 sub-categories of products, defective products by reason, and forecasted revenue.
Bullet Points about the Dashboard:
– Total sales, quantity ordered, revenue, and percentage of growth
– Graphs that explain the top 5 sub-categories of products
– Graphs that explain defective products by reason
– Graphs that forecast revenue by month
Summary of Who Can Benefit from Using the Dashboard and How: Manufacturers can benefit from using the Manufacturing Dashboard to gain insight into their sales, quantity ordered, revenue, percentage of growth, and production downtime. The dashboard also provides graphs that explain the top 5 sub-categories of products, defective products by reason, and forecasted revenue. This information can help manufacturers make informed decisions about their operations.
Bullet Points about Who Can Use the Dashboard and How It Would Benefit Them:
– Manufacturers can use the dashboard to gain insight into their sales, quantity ordered, revenue, percentage of growth, and production downtime.
– The dashboard provides graphs that explain the top 5 sub-categories of products, defective products by reason, and forecasted revenue.
– This information can help manufacturers make informed decisions about their operations.”
Data
The dashboard is called “Manufacturing Dashboard” The dashboard includes the total of sales,quantity ordered ,revenue,percentage of growth,the circle of the production down time:we have 3 circle appliances-furniture-hardwere acc for each is divide by time range <50,51-53,53-56,57+,an graph explaint top 5 sub-category chairs,phones,binders,storage,copiers explain by price and sold items and also the revenue.an graphe de dcatter distributon of sales vs quantity.an chart to defective products by rason explaint the pourcentage of the product (art,binders,furnishings,paper,phones,storage)divide by rason (misc,broken,not working).and the last graph forecasted revenue explain by month for reel and estimation.