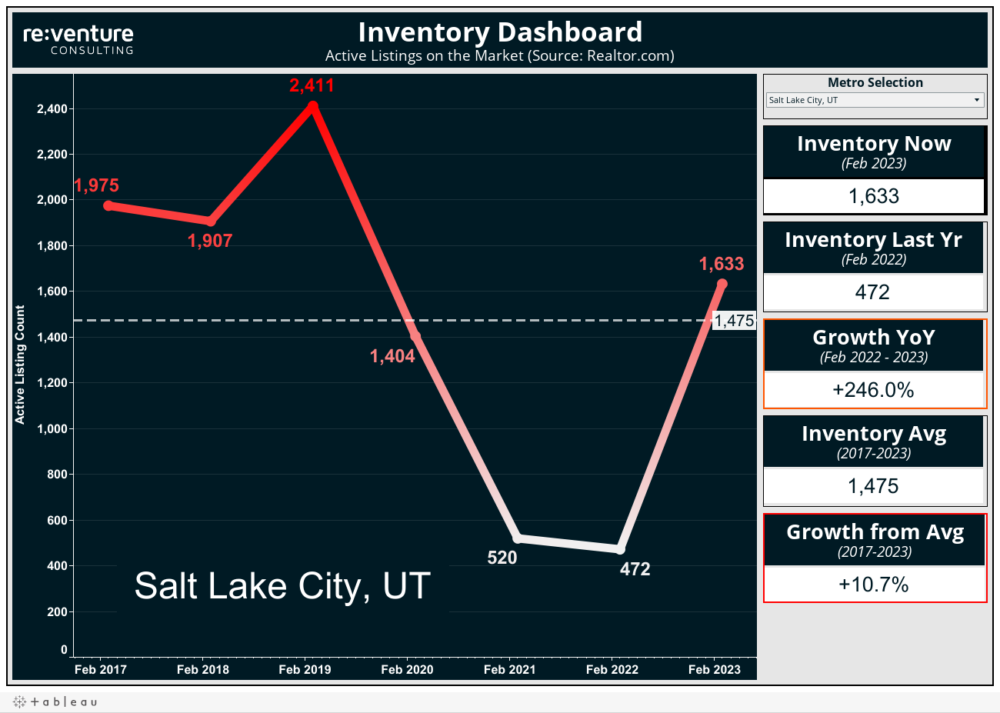
1. The Inventory Dashboard provides an overview of the active listing count evolution by date and by state. It includes data on inventory now, inventory last year, growth year-over-year, inventory average, and growth from average.
2. Bullet Points about the Dashboard:
• Provides an overview of active listing count evolution
• Includes data on inventory now, inventory last year, growth year-over-year, inventory average, and growth from average
• Shows data by date and by state
3. The Inventory Dashboard can be used by real estate agents, property managers, and investors to gain insight into the current market trends. It can help them make informed decisions about their investments and strategies.
4. Bullet Points about Who Can Use the Dashboard and How it Would Benefit Them:
• Real estate agents can use the dashboard to track market trends and make informed decisions about their investments
• Property managers can use the dashboard to monitor changes in the market and adjust their strategies accordingly
• Investors can use the dashboard to gain insight into current market trends and make informed decisions about their investments
Data
The dashboard is called Inventory Dashboard, the dashboard includes, Inventory Now, Inventory Last Yr, Growth YoY, Inventory AVG, Geowth From AVG, Inventory Dashboard, it shows the Active Listing Count evolution by date and by State