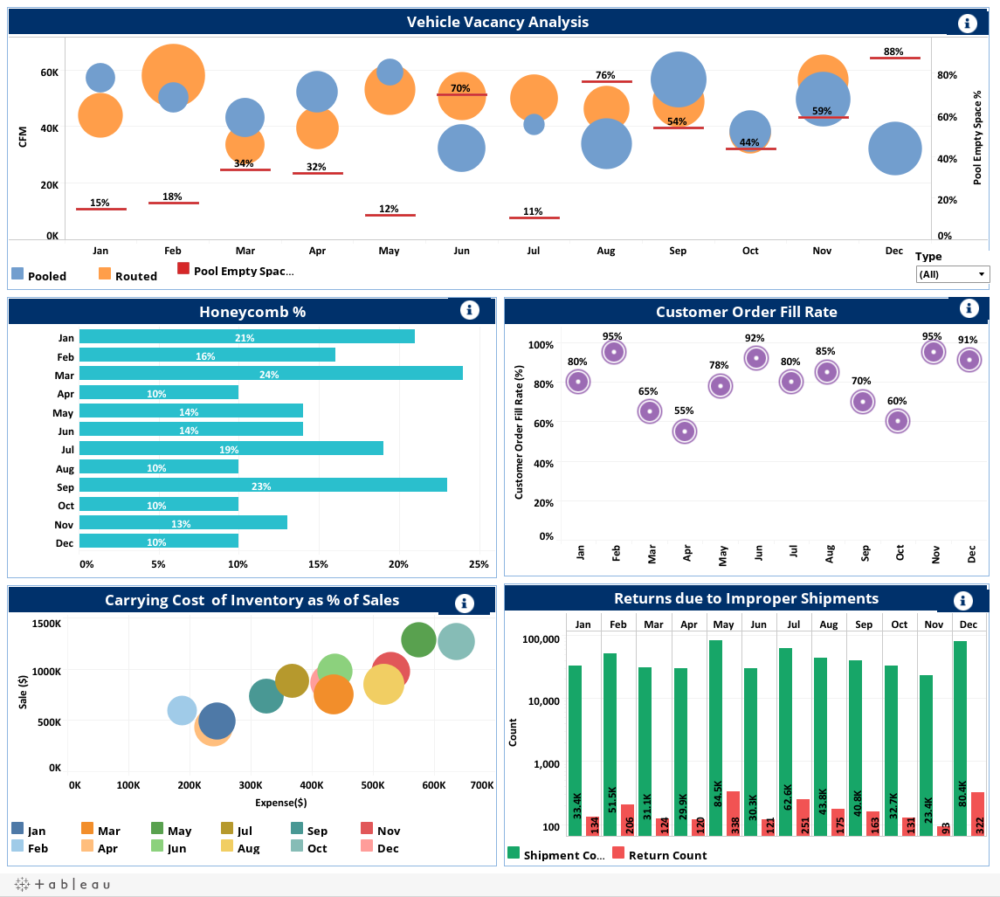
Overall Summary: This dashboard provides a comprehensive analysis of sales and expenses, customer order fill rate, carrying cost of inventory as a percentage of sales, and shipment and return counts, among other metrics, for the months of January through December.
Bullet Points About the Dashboard:
• Includes analysis of sales, expenses, customer order fill rate, carrying cost of inventory as a percentage of sales, and shipment and return counts
• Covers the months of January through December
• Provides an in-depth view of overall performance
Summary of Who Can Benefit from Using the Dashboard and How: Businesses, especially those dealing with sales, can benefit from using this dashboard to gain a better understanding of their overall performance. The dashboard provides a comprehensive analysis of sales, expenses, customer order fill rate, carrying cost of inventory as a percentage of sales, and shipment and return counts, among other metrics, which can help businesses identify areas of improvement and develop strategies to increase efficiency.
Bullet Points About Who Can Use the Dashboard and How It Would Benefit Them:
• Businesses can use this dashboard to gain a better understanding of their overall performance
• Can help businesses identify areas of improvement and develop strategies to increase efficiency
• Provides in-depth view of overall performance, including analysis of sales, expenses, customer order fill rate, carrying cost of inventory as a percentage of sales, and shipment and return counts
Data
Sale ($)
60K
40K
20K
18%
15%
OK
Jan
Feb
Pooled
Routed
34%
32%
Mar
Pool Empty Space%
Honeycomb %
12%
Vehicle Vacancy Analysis
70%
11%
76%
59%
54%
44%
i
88%
80%
0%
Apr
May
Jun
Jul
Aug
Sep
Oct
Nov
Dec
Type
All
Jan
Feb
Mar
ཤྲཱ སྠཽ ཎྜ ཝཿ ཎྜ རྗ ཟ ཟྭ ྣ ཙཾ རྗེ ༔
21%
16%
24%
Apr
10%
May
14%
Jun
14%
Jul
Aug
10%
Sep
19%
23%
Oct
10%
13%
Dec
10%
0%
5%
10%
15%
1500K
1000K
500K
Ok
Carrying Cost of Inventory as % of Sales
OK
100K
200K
300K
Customer Order Fill Rate (%)
95%
100%
80%
80%
60%
40%
20%
0%
£
20%
25%
i
100,000
Jan
Count
10,000
1,000
400K
500K
600K
700K
Expense($)
Jan
Mar
May
Jul
Feb
Apr
Jun
Aug
Sep Oct
Nov
Dec
Feb
Customer Order Fill Rate
65%
55%
92%
85%
78%
80%
70%
60%
៖
60%
40%
20%
95%
91%
Returns due to Improper Shipments
Mar Apr
May Jun
Jul Aug
Sep
Oct
Nov
Dec
29.9
100
Shipment Count
Return Count
84.5K
30.3K
121
62.6H
251
43.8K
175
40.8K
163
32.7K
131
93
23.4
322
Pool Empty Space%